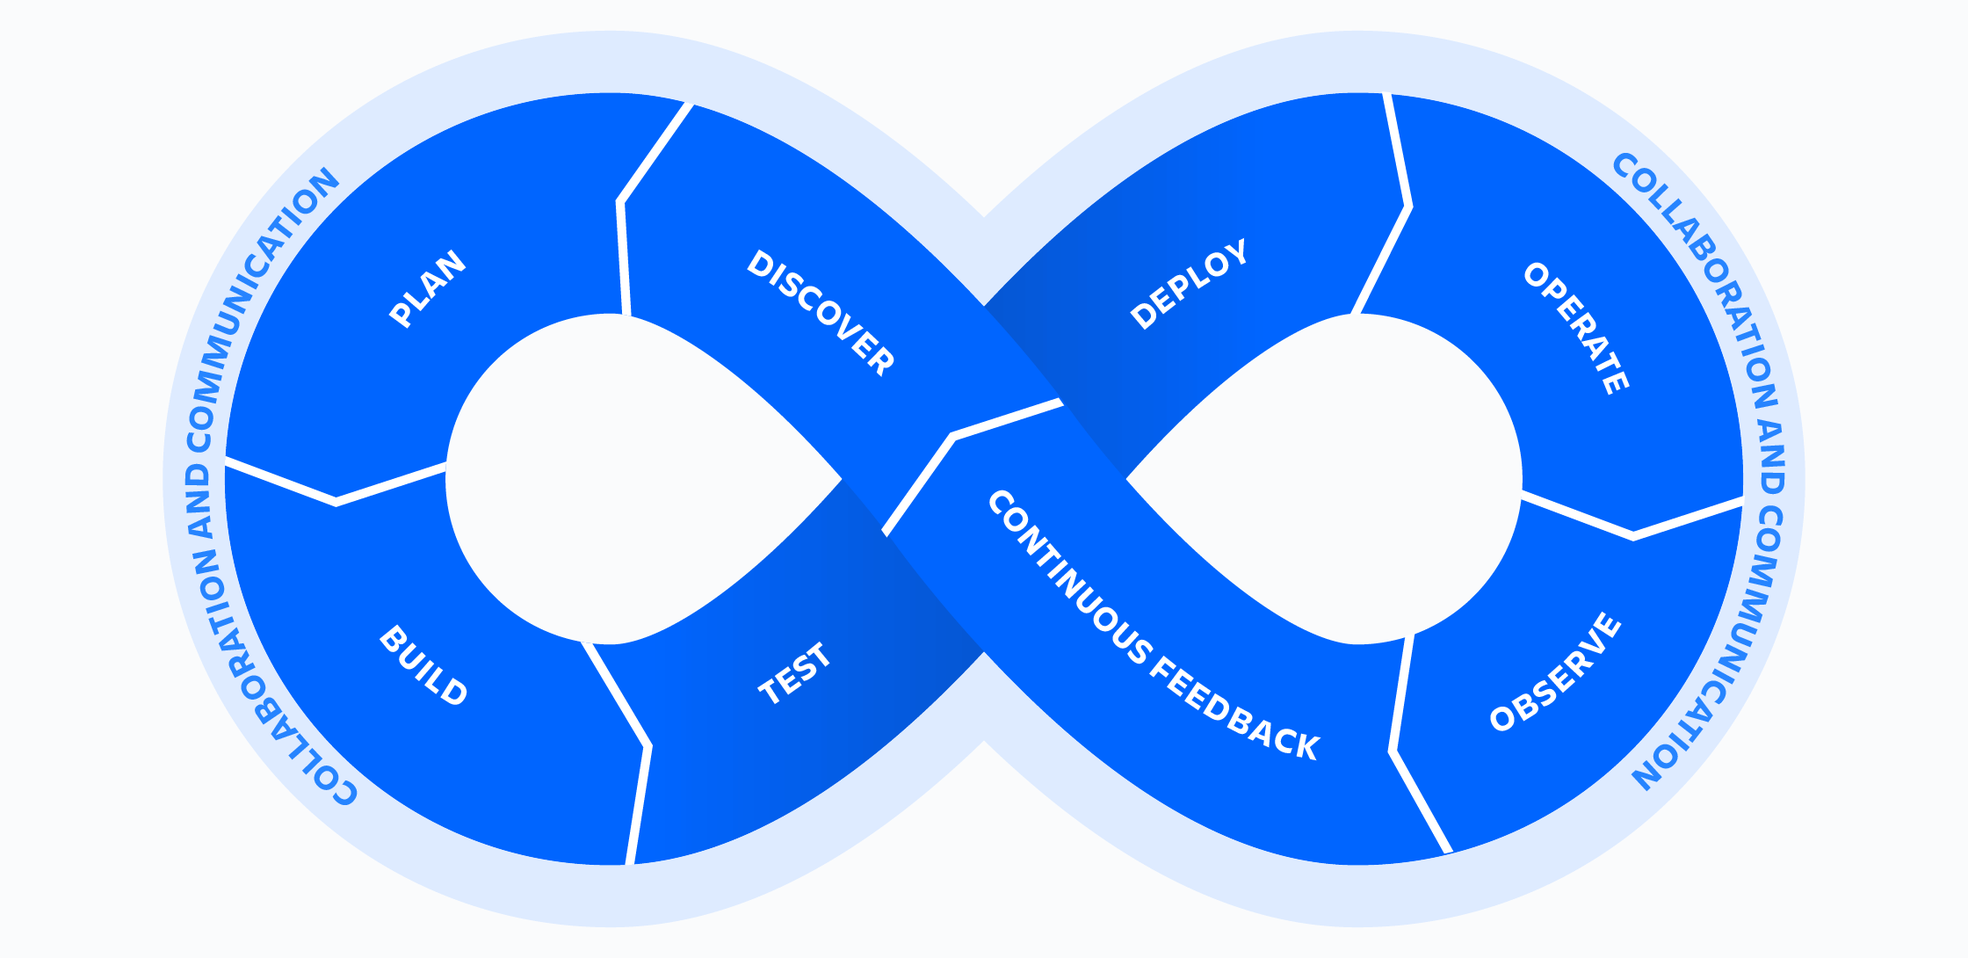
In modern software development, delivering reliable, high-performing applications is critical. DevOps emphasizes speed and agility, but without proper monitoring and logging, fast releases can lead to undetected failures, downtime, and poor user experiences.
Monitoring and logging are essential components of a robust DevOps workflow. They provide visibility into application performance, infrastructure health, and system behavior, enabling teams to proactively identify and resolve issues. In this blog, we will explore the importance of monitoring and logging in DevOps, the tools commonly used, best practices, and the benefits of adopting a comprehensive observability strategy.
Table of Contents
Why Monitoring and Logging Are Critical in DevOps
Monitoring and logging provide real-time insights into the health of applications and infrastructure. They serve several key purposes in a DevOps environment:
- Proactive Issue Detection: Monitoring allows teams to identify performance bottlenecks, errors, or anomalies before they impact end users.
- Root Cause Analysis: Logs provide detailed context for diagnosing issues, allowing faster resolution and minimizing downtime.
- Continuous Improvement: Observability data helps teams identify trends, optimize performance, and make informed decisions for future releases.
- Compliance and Auditing: Proper logging ensures traceability and supports regulatory compliance in industries such as finance and healthcare.
According to Dynatrace, integrating monitoring and logging into the DevOps pipeline is essential for maintaining application reliability and ensuring a seamless user experience.
Types of Monitoring in DevOps
Monitoring in DevOps can be categorized into several key types:
Infrastructure Monitoring
Infrastructure monitoring tracks the health and performance of servers, networks, storage, and other infrastructure components. Metrics such as CPU usage, memory consumption, disk I/O, and network latency help teams maintain system stability. Tools like Prometheus and Nagios are widely used for infrastructure monitoring.
Application Performance Monitoring (APM)
APM focuses on measuring application behavior, including response times, error rates, throughput, and user interactions. It helps developers understand how code changes affect performance. Popular APM tools include New Relic and AppDynamics.
Log Monitoring
Logs contain detailed records of system events, errors, and user activity. Log monitoring tools aggregate, index, and visualize log data, allowing teams to detect anomalies quickly. The ELK Stack (Elasticsearch, Logstash, Kibana) is a popular choice for centralized logging and visualization.
Synthetic and Real User Monitoring
Synthetic monitoring simulates user interactions to test application performance proactively, while real user monitoring (RUM) captures actual user experiences. Tools like Pingdom and Datadog provide comprehensive monitoring for both simulated and real-world scenarios.
Key Logging Practices in DevOps
Logging is essential for observability and troubleshooting. Effective logging practices include:
Structured Logging
Structured logging formats log entries consistently, making it easier to query, filter, and analyze data. JSON is a common format used for structured logs.
Centralized Logging
Collecting logs from multiple sources into a centralized platform improves accessibility and correlation. Platforms like Graylog or the ELK Stack provide centralized logging capabilities.
Log Retention and Rotation
Implement log retention policies to store logs for a defined period and rotate older logs to maintain storage efficiency. This ensures compliance and resource optimization.
Contextual Logging
Include relevant context in logs, such as user IDs, request IDs, and transaction details, to facilitate root cause analysis and debugging.
Best Practices for DevOps Monitoring and Logging
Integrate Monitoring into CI/CD Pipelines
Incorporate monitoring and logging into your CI/CD pipelines to detect issues early in the deployment process. Automated alerts can prevent faulty releases from reaching production.
Use Alerts and Notifications Wisely
Configure alerts for critical metrics and anomalies, but avoid alert fatigue by prioritizing high-impact issues. Tools like PagerDuty and Opsgenie help manage notifications effectively.
Ensure End-to-End Observability
Combine infrastructure, application, and log monitoring to achieve full observability. This holistic approach allows teams to identify performance bottlenecks and dependencies across systems.
Leverage Dashboards and Visualization
Visual dashboards provide at-a-glance insights into system health. Tools like Grafana and Kibana make monitoring data actionable and understandable for both technical and non-technical stakeholders.
Conduct Regular Reviews and Audits
Regularly review monitoring metrics and logs to identify patterns, optimize system performance, and ensure compliance with policies and regulations.
Benefits of Monitoring and Logging in DevOps
Faster Incident Response
Real-time monitoring and detailed logs allow teams to detect and resolve issues quickly, minimizing downtime and service disruption.
Improved Reliability and Performance
Continuous monitoring helps maintain system health, optimize resource usage, and enhance application performance.
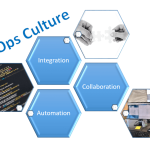
Enhanced Collaboration
Observability data fosters collaboration between development, operations, and QA teams, providing a shared understanding of system behavior.
Data-Driven Decision Making
Monitoring and logging data enable informed decisions for scaling, capacity planning, and improving application features.
Compliance and Audit Readiness
Proper logging ensures traceability of actions and events, supporting regulatory compliance and security audits.
Conclusion
Monitoring and logging are fundamental components of DevOps that provide visibility, reliability, and control over complex systems. By implementing infrastructure, application, and log monitoring, along with structured and centralized logging practices, organizations can ensure high availability, rapid issue resolution, and continuous improvement.
Tools like Prometheus, Grafana, ELK Stack, and Datadog empower teams to maintain robust observability and optimize performance across the software lifecycle. Incorporating monitoring and logging into DevOps workflows is no longer optional it is essential for delivering reliable, high-quality software in today’s fast-paced environment.
For further learning, explore the ELK Stack Documentation and Datadog Monitoring Best Practices for practical implementation strategies.
Also Check Infrastructure as Code – Powerful Infrastructure – 2026


1 thought on “Monitoring and Logging in DevOps – Best Practices – 2026”